How To Measure Your Social Media Performance With Google Analytics
Last Updated: October 29, 2022

Measuring social media performance can be tricky. Most of the interactions happen on a 3rd party platform, which means you are at the mercy of the reporting provided and integrations available from the platforms in question, in this case social media websites. Getting a complete picture of what’s happening in terms of lead generation and results generated on social media will never happen, but it is possible to get directional feedback on what the impacts of your efforts are through Google Analytics. In today’s post we’ll talk about some of the reports I look at when diagnosing new client’s social media performance and how you can measure your social media performance with Google Analytics.
Understanding The Value Of Google Analytics Social Media Reporting
Before we dive into the reports, let’s take a second to review a few quick things about Google Analytics and what it’s really telling you. First of all it’s helpful to understand that Google Analytics will only be able to give you feedback on visits to your website. A lot of conversions, engagement, and the value that will come from using social media to market your business will happen on the platform. Still, if you’re creating blog content, and promoting your website (which you should be) you will drive people to your website, and it’s important to understand what’s happening after they’ve arrived.
One other point to remember is that anytime you’re dealing with analytics, you’re dealing with a sampling of your website’s true visitors. Web analytics platforms, such as Google Analytics, use JavaScript to handle their tracking. Visitors can use tools like privacy enabled browsers, ad blocks, opt-out extensions, and other means to block analytics from tracking them across the web. This means your results will be limited to the trackable visitors.
You may only be getting a fraction of the picture when it comes to social media, but Google Analytics is still valuable. It can give you directional feedback on the success of platforms, landing pages, conversion rates, and more. Without further ado, let’s take a look at a couple of the reports that can provide you with this information.
Google Analytics Traffic Channels Social Media Report
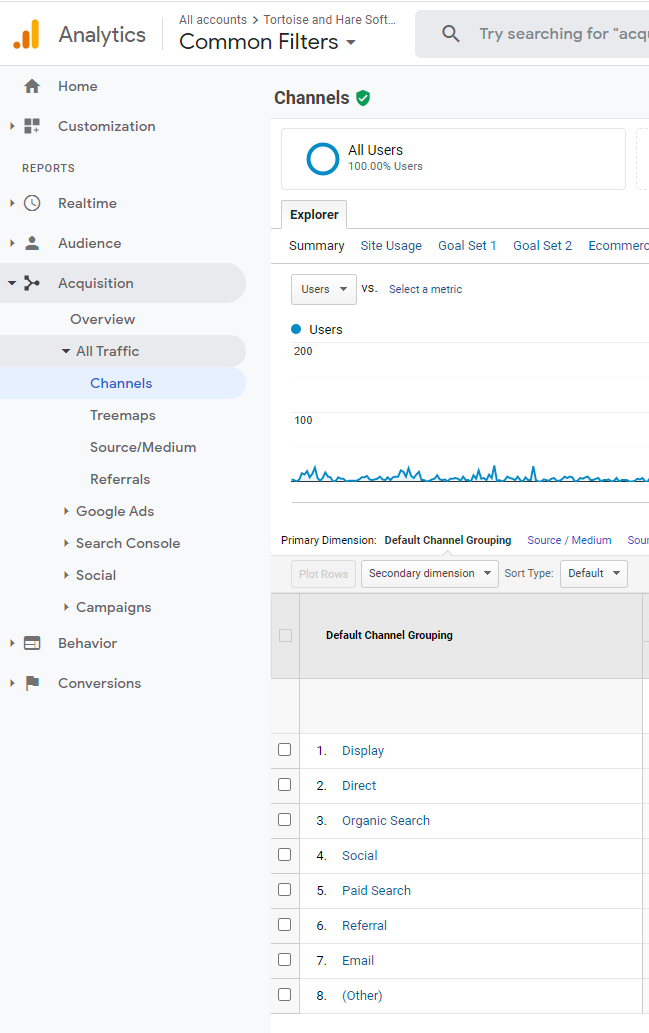
The first step is to open your preferred Google Analytics view and go to Acquisition > All Traffic > Channels. This report will show you a breakdown of all the traffic channels of your website. Once you’re on the report you can click on “Social” to drill down into the report and view data specific to that channel.
Once you’ve drilled down you can:
- Change the date range to your preferred date.
- View your social media platform performance.
- Observe your conversion rates on each social media platform.
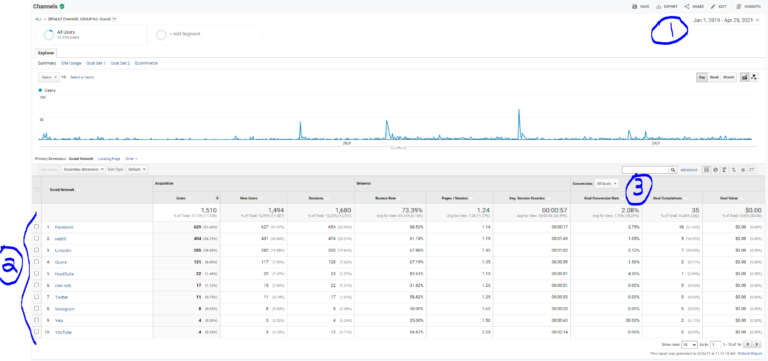
Some questions for you to ponder as you look at your own analytics data
- What platforms are driving the most traffic?
- Which ones have the highest engagement in terms of session durations?
- What platforms are driving the most leads in terms of volume?
- What platforms are driving the most leads in terms of conversions rates?
- Based off the data at hand, how can you be more efficient with your social media marketing efforts?
Some of these questions assume you have proper conversion tracking set up. If you don’t have your conversion tracking in order, the value of both social media marketing measurement and Google Analytics as a whole goes way down, and it becomes very difficult to make educated decisions about marketing investments. Make sure you have set up your Google Analytics Goals!
Google Analytics Social Report
Our next stop is the social report in Google Analytics. I won’t go through this one in full, but I will take a moment to highlight a couple of useful metrics that I like to look at. To get to this report you’ll go to Acquisition > Social > Overview

I really love two things about this report. The first is the circular diagram on the left. It shows you the total number of conversions you’ve generated, the number of conversions that social media contributed to, and the number of conversions that were a result of social media directly as the last channel touched. Many brands will fail to understand the value of contributed conversions in B2B. That is people who convert on another channel, such as organic search or paid search, but who at some point in their user journey, interacted with social media content along the way.
Contributed conversions are one of the easiest ways to under value social media. These won’t show up in 95% of the other reports in Google Analytics but again, social media often plays a significant role in the middle funnel of buyers journeys an ultimately contributes to people choosing to do business with your company. The contributed conversions report helps get a better understanding of the role social media is playing in that sense.
The number of contributed and last touch conversion from social media can be found on the right, but is visualized in the diagram.
The Social Landing Pages Report
One other report I like to check out within this same group is the landing pages report, found by going to Acquisition > Social > Landing Pages.
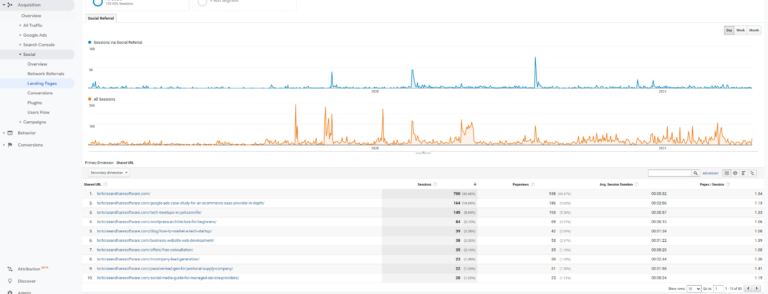
This report can show you some of the top content that people clicked off the platform, and on to your website for. You can get some feedback on engagement levels with the content, with average session durations and comparing the number of sessions with pageviews. It’s also possible to understand conversion rates per landing page by doing some more advanced report configuration beyond the scope of this post.
Like our insights?
Subscribe to our email list, and get the latest posts straight to your inbox.
Top Conversion Paths Report In Google Analytics
The last report we’ll look at in this post is the top conversion paths report. This report helps you get an understanding of complete customer journeys before converting on your website. Understand that analytics tracking is imperfect when doing cross device tracking (for instance a user visiting your website on both a desktop and a mobile device along the way) so this report will really only capture journey’s completed on a single device. This can again be useful to directionally understand the conversion paths your users are taking.
To access this report, go to Conversions > Multi-Channel Funnels > Top Conversion Paths. I like to change the path length at the top to “All” and adjust the lookback window to the maximum available 90 days.
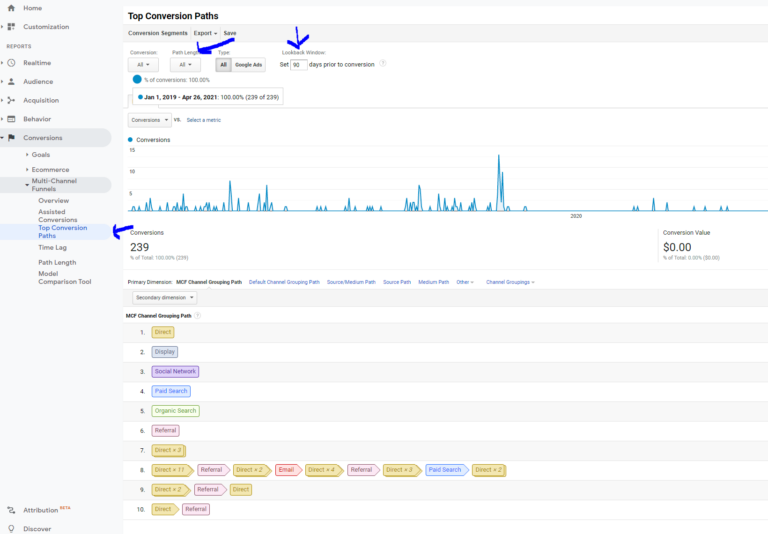
Feel free to dive into the report in a broader context, but since this post is about social media we have one more step we want to complete and that’s to create a conversion segment.
Click on the conversion segments button next to the path length drop down. Next click on Create New Conversion Segment .

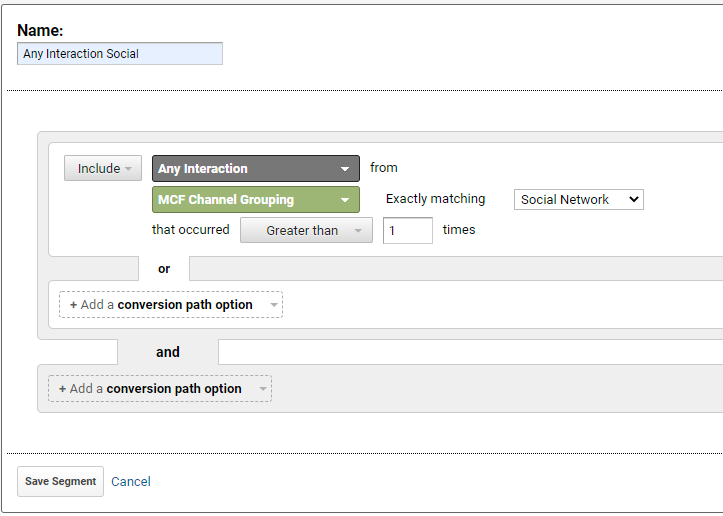
Name your segment and change the settings to include any interaction from a MCF Channel Grouping that is exactly matching Social Network that occurred greater than 1 times as shown in the image below. Click save segment.
Next you’ll want to apply your segment and take another look at the report.

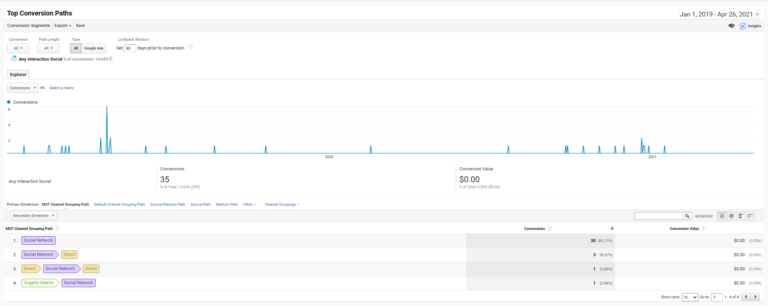
This will filter the top conversion paths report by customer journeys that had a social media touch anywhere along the way. The TNHS site is relatively low volume compared to larger businesses, but you can still see a few different conversion journeys that included a social media touch in the report above. Use this report to get a better understanding of how social media plays a role in your customer’s journey. Do you have a high percentage of social media, single channel journeys? You may need to invest more into that channel. Is social media playing a significant role in multi touch journeys? Maybe you need to create landing pages that encourage people to follow you on social media for cold traffic as an interim call to action as you move your visitors down the funnel. An experienced marketing consultant can help you interpret the results.
Wrapping Up
In this post we’ve covered a few select reports in Google Analytics that can help you get more visibility into how your performing on social media with your social media marketing efforts. We looked at the traffic channels report, the social report, and the top conversion paths report. We discussed how these reports can give you directional feedback on the best networks, content, and conversion methods that you can use to help guide your social media marketing investment decisions. What did you discover when taking a look at your analytics? Questions? Thoughts? Let us know in the comments below.

















Leave a Comment