How Much Can My MSP Afford To Spend On Google Ads?
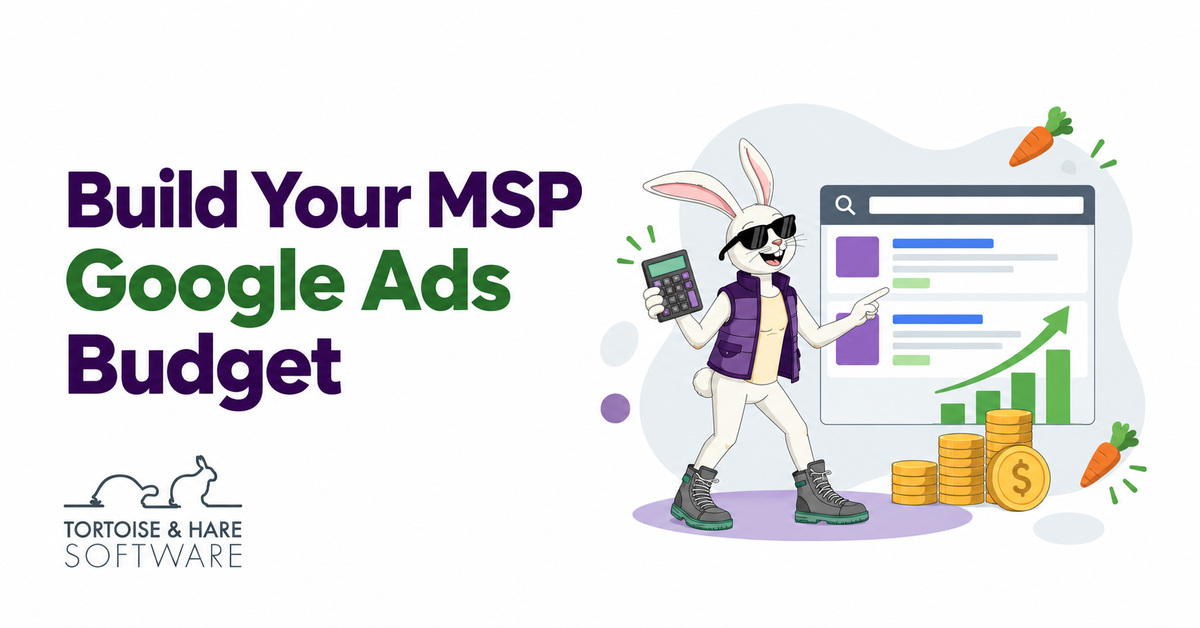
One of the first questions I get from MSP owners about Google Ads is, “How much should I spend each month?” It’s a fair question. You want to grow, but you also need to know what that growth will cost and when the investment starts coming back.
Managed services gives you a good reason to invest in customer acquisition: a customer you win today can keep paying you for years. You pay to create the opportunity up front, then earn the return over the relationship. That gap is part of building a recurring revenue business.
For an MSP with sound customer economics and a well-run campaign, the challenge is often less “Does Google Ads work?” and more “Do we have enough cash or free cash flow to fund the initial investment and payback period?” Both questions matter. We need evidence that the campaign is winning valuable customers, and a budget that gives those opportunities time to close.
You may already have money set aside for marketing. In that case, the decision is how to put that budget to its best use. Compare Google Ads with the cost, speed, and quality of your other sources of new business. An existing marketing budget can make the investment easier to fund, but the campaign still needs to earn its place.
I’ve seen MSP clients beat the lead costs and close rates we’ll use below. These are reasonable planning estimates with room to outperform, not a promise of results or a ceiling on what a good campaign can do. We’ll use a six-month startup period and a 50% gross margin. To keep the projection easy to follow, we’ll also assume customers stay, pay on time, and generate a steady allowance for projects and hardware. Those last assumptions simplify the forecast. Adjust them for your own retention and payment history.
Let’s build the budget one step at a time: customer revenue, gross profit, acquisition cost, lead cost, and then the monthly investment. We’ll finish with an 18-month view and a five-year projection. Along the way, we’ll separate customer payback from campaign growth, and recurring services revenue from blended revenue.
Step 1: Calculate Gross Revenue
Start with the customer you want to serve. We’ll use $250 per seat per month, where a seat means one billable employee. Assume a 60-month customer relationship and add 25% to services revenue for onboarding, projects, and hardware over that relationship.
Monthly services revenue = Seats x $250
60-month services revenue = Monthly services revenue x 60
Lifetime gross revenue = 60-month services revenue x 1.25
| Customer Size | Managed Services MRR | 60-Month Services Revenue | Additional Revenue At 25% | Lifetime Gross Revenue |
|---|---|---|---|---|
| 10 seats | $2,500 | $150,000 | $37,500 | $187,500 |
| 20 seats | $5,000 | $300,000 | $75,000 | $375,000 |
| 40 seats | $10,000 | $600,000 | $150,000 | $750,000 |
| 80 seats | $20,000 | $1,200,000 | $300,000 | $1,500,000 |
One seat produces $15,000 in services revenue over five years. With the additional revenue allowance, that becomes $18,750. The extra 25% is part of total customer value. It is not managed services MRR.
Step 2: Calculate Gross Profit And Customer Lifetime Value
Revenue tells us what a customer pays. Gross profit tells us what remains after the direct cost of serving that customer. That is the better starting point for deciding what you can spend to win them.
We’ll use a 50% blended gross margin across services and the additional revenue. In this article, customer lifetime value (LTV or CLTV) means lifetime gross profit.
LTV per seat = $18,750 lifetime revenue x 50% gross margin
LTV per seat = $9,375
20-seat customer LTV = 20 x $9,375 = $187,500
Use your own margin here. Higher revenue does less for your acquisition budget when most of it goes toward delivery costs. Strong margins and customer retention give you more room to invest in growth. Gross profit still needs to cover acquisition costs, overhead, and other business expenses.
Step 3: Set Your Customer Acquisition Cost Target
Customer acquisition cost (CAC) includes the marketing and sales costs required to win a customer. To set a target, divide lifetime gross profit by the LTV:CAC ratio you want to maintain.
Target CAC = Customer LTV / Target LTV:CAC ratio
20-seat customer at 5:1 = $187,500 / 5 = $37,500
A 5:1 target allows $1,875 in total acquisition cost per seat. A 3:1 target allows $3,125. The lower ratio gives you more room to pay for growth, but leaves less lifetime gross profit after acquisition costs.
| Customer Size | Lifetime Gross Profit | Total CAC At 5:1 | Total CAC At 3:1 |
|---|---|---|---|
| 10 seats | $93,750 | $18,750 | $31,250 |
| 20 seats | $187,500 | $37,500 | $62,500 |
| 40 seats | $375,000 | $75,000 | $125,000 |
| 80 seats | $750,000 | $150,000 | $250,000 |
I use 3:1 to 5:1 as a healthy planning sweet spot for balancing growth with acquisition efficiency. At 3:1, each dollar spent winning a customer produces three dollars in expected lifetime gross profit. At 5:1, it produces five. That leaves room to cover overhead and earn a return while still investing in new business.
Closer to 3:1, you’re accepting a higher acquisition cost to pursue growth more aggressively. Closer to 5:1, you’re keeping more lifetime gross profit after acquisition costs and giving yourself a larger cushion. We’ll use 5:1 for the main example.
| LTV:CAC Ratio | What It Can Signal | What To Consider |
|---|---|---|
| Below 3:1 | Higher acquisition risk and less room for error | Improve lead costs, conversion rates, margins, or retention before scaling. |
| 3:1 to 5:1 | A healthy balance between growth and acquisition efficiency | Choose your pace based on cash available, payback, and delivery capacity. |
| Above 5:1 | Strong efficiency, with possible underinvestment in growth | Test whether more spending can win additional customers at an acceptable cost. |
Below 3:1, acquisition costs consume more of the value each customer brings. That leaves less room for overhead, delayed payments, or a customer who leaves earlier than expected. It is a signal to review the economics before committing more money, even if the customer remains profitable.
Above 5:1, you may have room to invest more and grow faster. If you’re winning valuable customers at a low cost but adding fewer accounts than you want, protecting the highest possible ratio can mean leaving good opportunities on the table. Test additional spending and watch the cost of the next customers you win, since scaling can increase CAC.
These are signals to investigate, not automatic verdicts. A high ratio can reflect excellent performance, and a lower ratio may fit a business with fast payback and ample cash. For your MSP, read the ratio alongside the sales cycle, customer retention, cash position, and capacity to serve new accounts.
Step 4: Allocate Your Budget Between Marketing And Sales
Your total CAC limit is not all available for Google Ads. You also need to account for the cost of following up, preparing proposals, and closing business.
For this model, allocate 60% of CAC to marketing and 40% to sales. A 20-seat customer with a $37,500 total CAC limit therefore supports $22,500 in marketing costs and $15,000 in sales costs.
Marketing allowance = $37,500 x 60% = $22,500
Sales allowance = $37,500 x 40% = $15,000
The split is an assumption, not a requirement. A founder-led MSP and a company with a dedicated sales team may have different cost structures. Agency fees, landing pages, and tracking also use part of the marketing allowance. Deduct those costs before treating the rest as an ad spend limit.
Step 5: Work Backward To Your Cost Per Lead
Now connect the marketing allowance to your sales funnel. Assume 50% of raw leads qualify and you close 20% of qualified leads. A raw MSP lead is a business inquiry. A qualified lead is an opportunity that fits your services and customer criteria. Google Ads supports qualified and converted lead tracking so you can measure inquiries through to sales.
At those rates, ten raw leads produce five qualified leads and one customer on average. Actual sales come in unevenly, but these averages help us set a budget.
Qualified leads per customer = 1 / 20% = 5
Raw leads per customer = 5 / 50% = 10
Marketing cost per raw lead limit = $22,500 / 10 = $2,250
That gives our 20-seat customer a $2,250 raw-lead cost ceiling at the 5:1 target, before reserving money for other marketing expenses. Better qualification or closing improves that ceiling. Weaker rates lower it. Cheap inquiries are only useful when enough of them become customers.
Step 6: Compare Your Limit With Google Ads Lead Costs
In my experience, raw Google Ads leads for MSPs often cost between $1,250 and $2,500. Market competition, keywords, local click prices, and landing page performance all affect that number. Your own campaign data should replace this starting estimate as results come in.
| Customer Size | Marketing CPL Ceiling At 5:1 | Marketing CPL Ceiling At 3:1 |
|---|---|---|
| 10 seats | $1,125 | $1,875 |
| 20 seats | $2,250 | $3,750 |
| 40 seats | $4,500 | $7,500 |
| 80 seats | $9,000 | $15,000 |
These ceilings include the 60% marketing allocation, 50% qualification rate, and 20% close rate. They show why customer size matters. A campaign that mostly wins ten-seat accounts has tighter economics than one that wins twenty- or forty-seat accounts.
At twenty seats, much of the $1,250 to $2,500 range fits the 5:1 allowance, but the high end exceeds it even before other marketing costs. That is a reason to improve the funnel, customer mix, or cost structure. It is not a reason to assume every lead in that range is profitable.
Google Ads won’t deliver the same customer size every time. Track the seats and gross profit you win alongside CPL. A larger account can justify a higher lead cost, while a stream of small accounts may require stronger conversion rates to produce the same return.
For a deeper look at campaign execution, watch my ScaleCon presentation on mastering Google Ads for MSPs.
Step 7: Fund The First Six Months
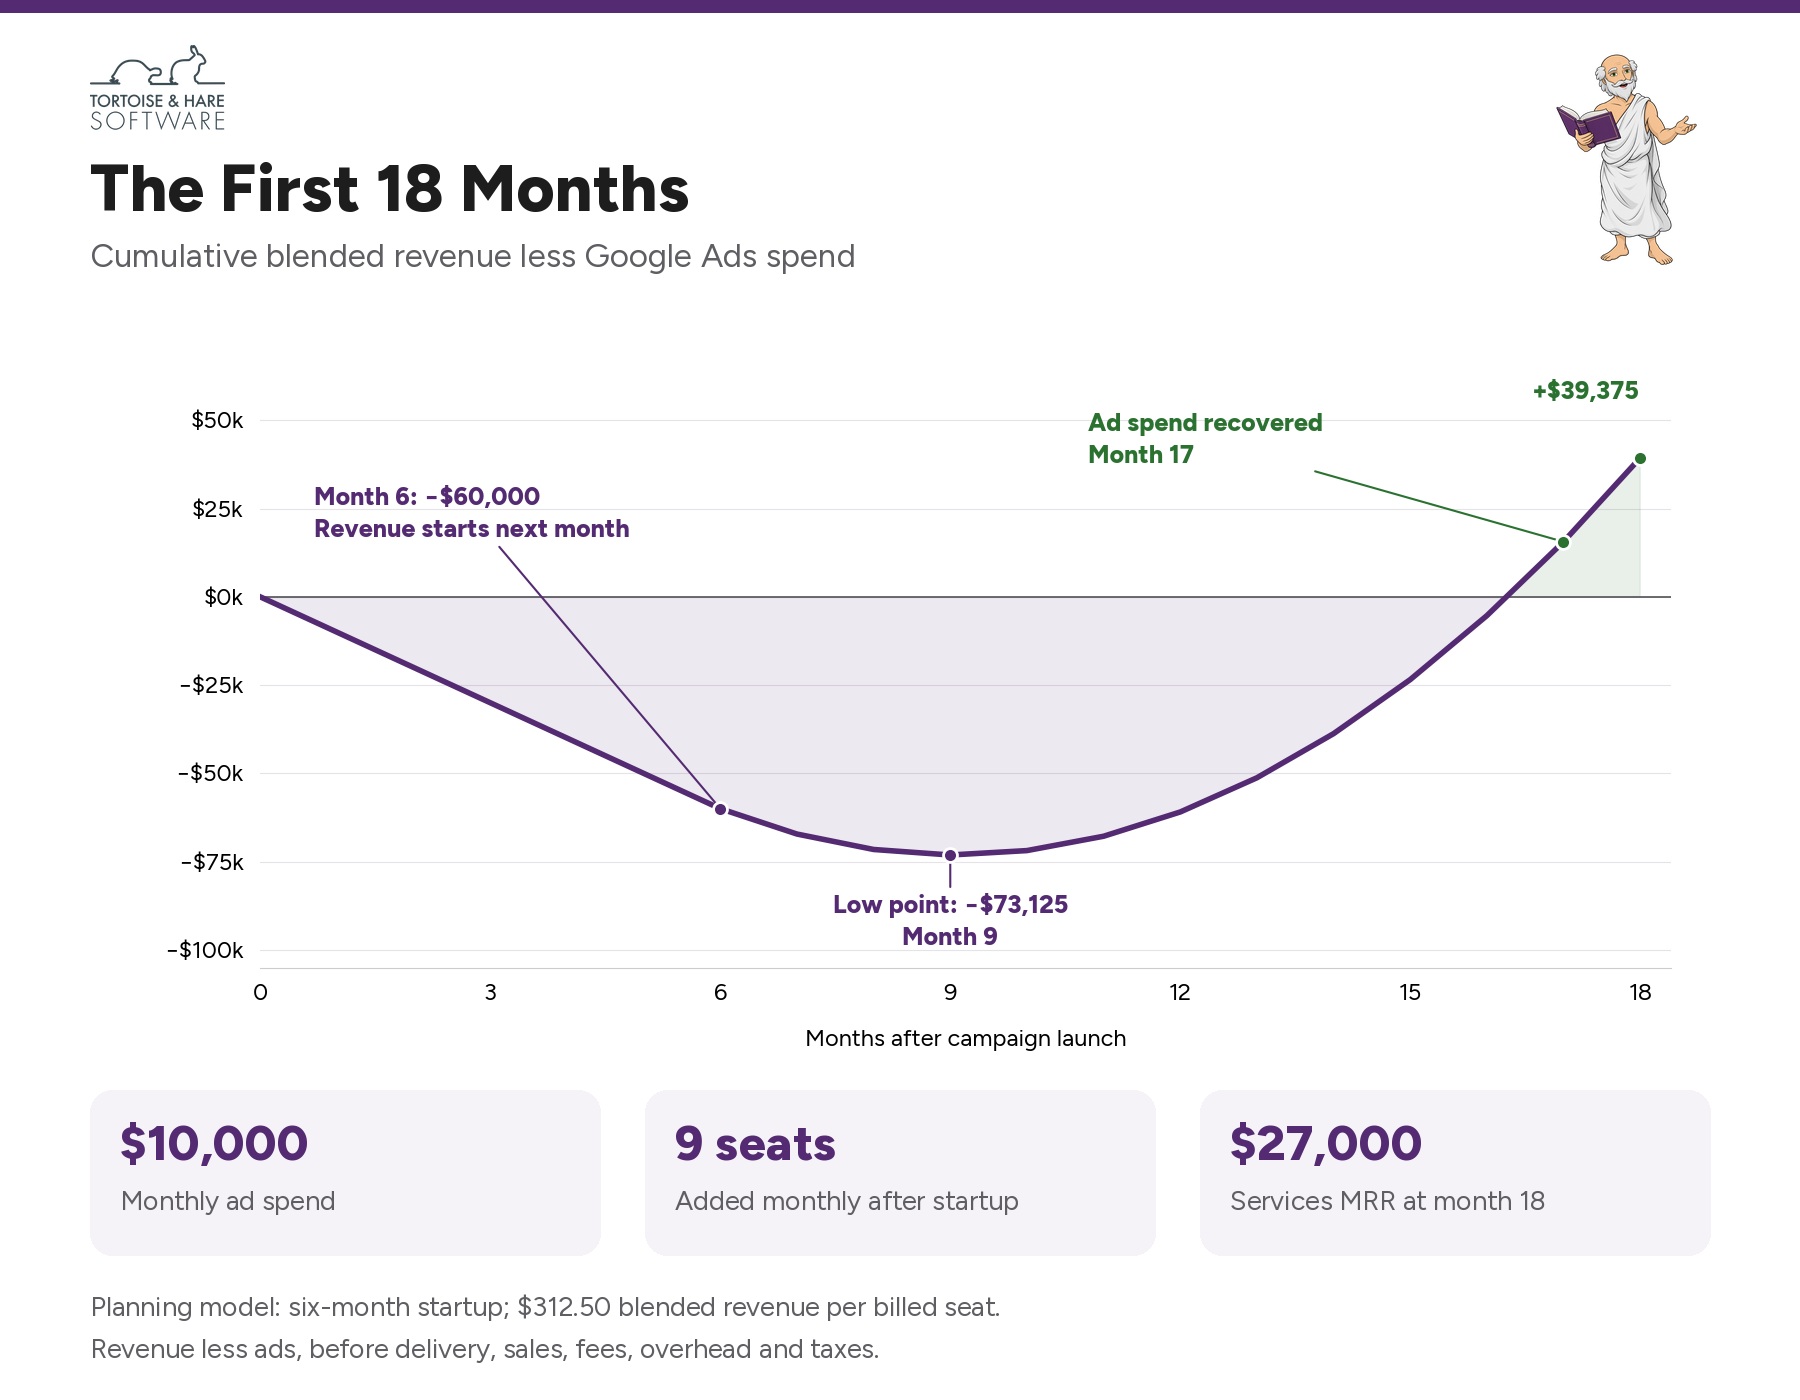
Now that we know what a customer is worth and what we can afford to pay for leads, let’s choose a monthly budget. We’ll use $10,000 in Google Ads spend and allow six months for the campaign to attract qualified leads and close its first deals.
That means funding $60,000 in ads before new customer revenue begins. Assume the first nine seats are won at the end of month six and start paying in month seven.
Your MSP Google Ads budget needs to fit your cash position. A $5,000 monthly budget can also be viable and reduces that initial six-month ad investment to $30,000. For the projection below, we’ll stay with $10,000 so you can follow one set of numbers.
Step 8: Build An 18-Month Google Ads Projection
At a $2,000 cost per raw lead, our $10,000 monthly budget produces five inquiries. Apply the qualification and close rates from Step 5, then multiply by eighteen seats per customer:
| Monthly Funnel | Planning Average |
|---|---|
| Google Ads spend | $10,000 |
| Raw leads at $2,000 CPL | 5 |
| Qualified leads at 50% | 2.5 |
| Customers won at a 20% close rate | 0.5 |
| Seats per customer | 18 |
| New managed seats | 9 |
That gives us an average of nine new seats per month once sales begin. Each nine adds $2,250 in managed services MRR. Including the 25% projects and hardware allowance, it adds $2,812.50 in blended monthly revenue.
The first nine seats start paying in month seven. Nine more start paying in month eight, bringing the total to eighteen. Another nine start in month nine, bringing the total to twenty-seven. The customers already won keep paying as new ones are added.
| Month | Total Billed Seats | Managed Services MRR | Blended Monthly Revenue |
|---|---|---|---|
| 6 | 0 | $0 | $0 |
| 7 | 9 | $2,250 | $2,812.50 |
| 12 | 54 | $13,500 | $16,875 |
| 18 | 108 | $27,000 | $33,750 |
By month eighteen, you’ve added $27,000 in managed services MRR with the same $10,000 monthly ad budget. Blended monthly revenue has reached $33,750.
The initial funding gap also starts to close. Cumulative revenue less ad spend is negative $60,000 at month six and bottoms out at negative $73,125 in month nine. It rebounds from month ten, covers cumulative ad spend in month seventeen, and reaches positive $39,375 in month eighteen.
The Five-Year Value Of Investing In Google Ads
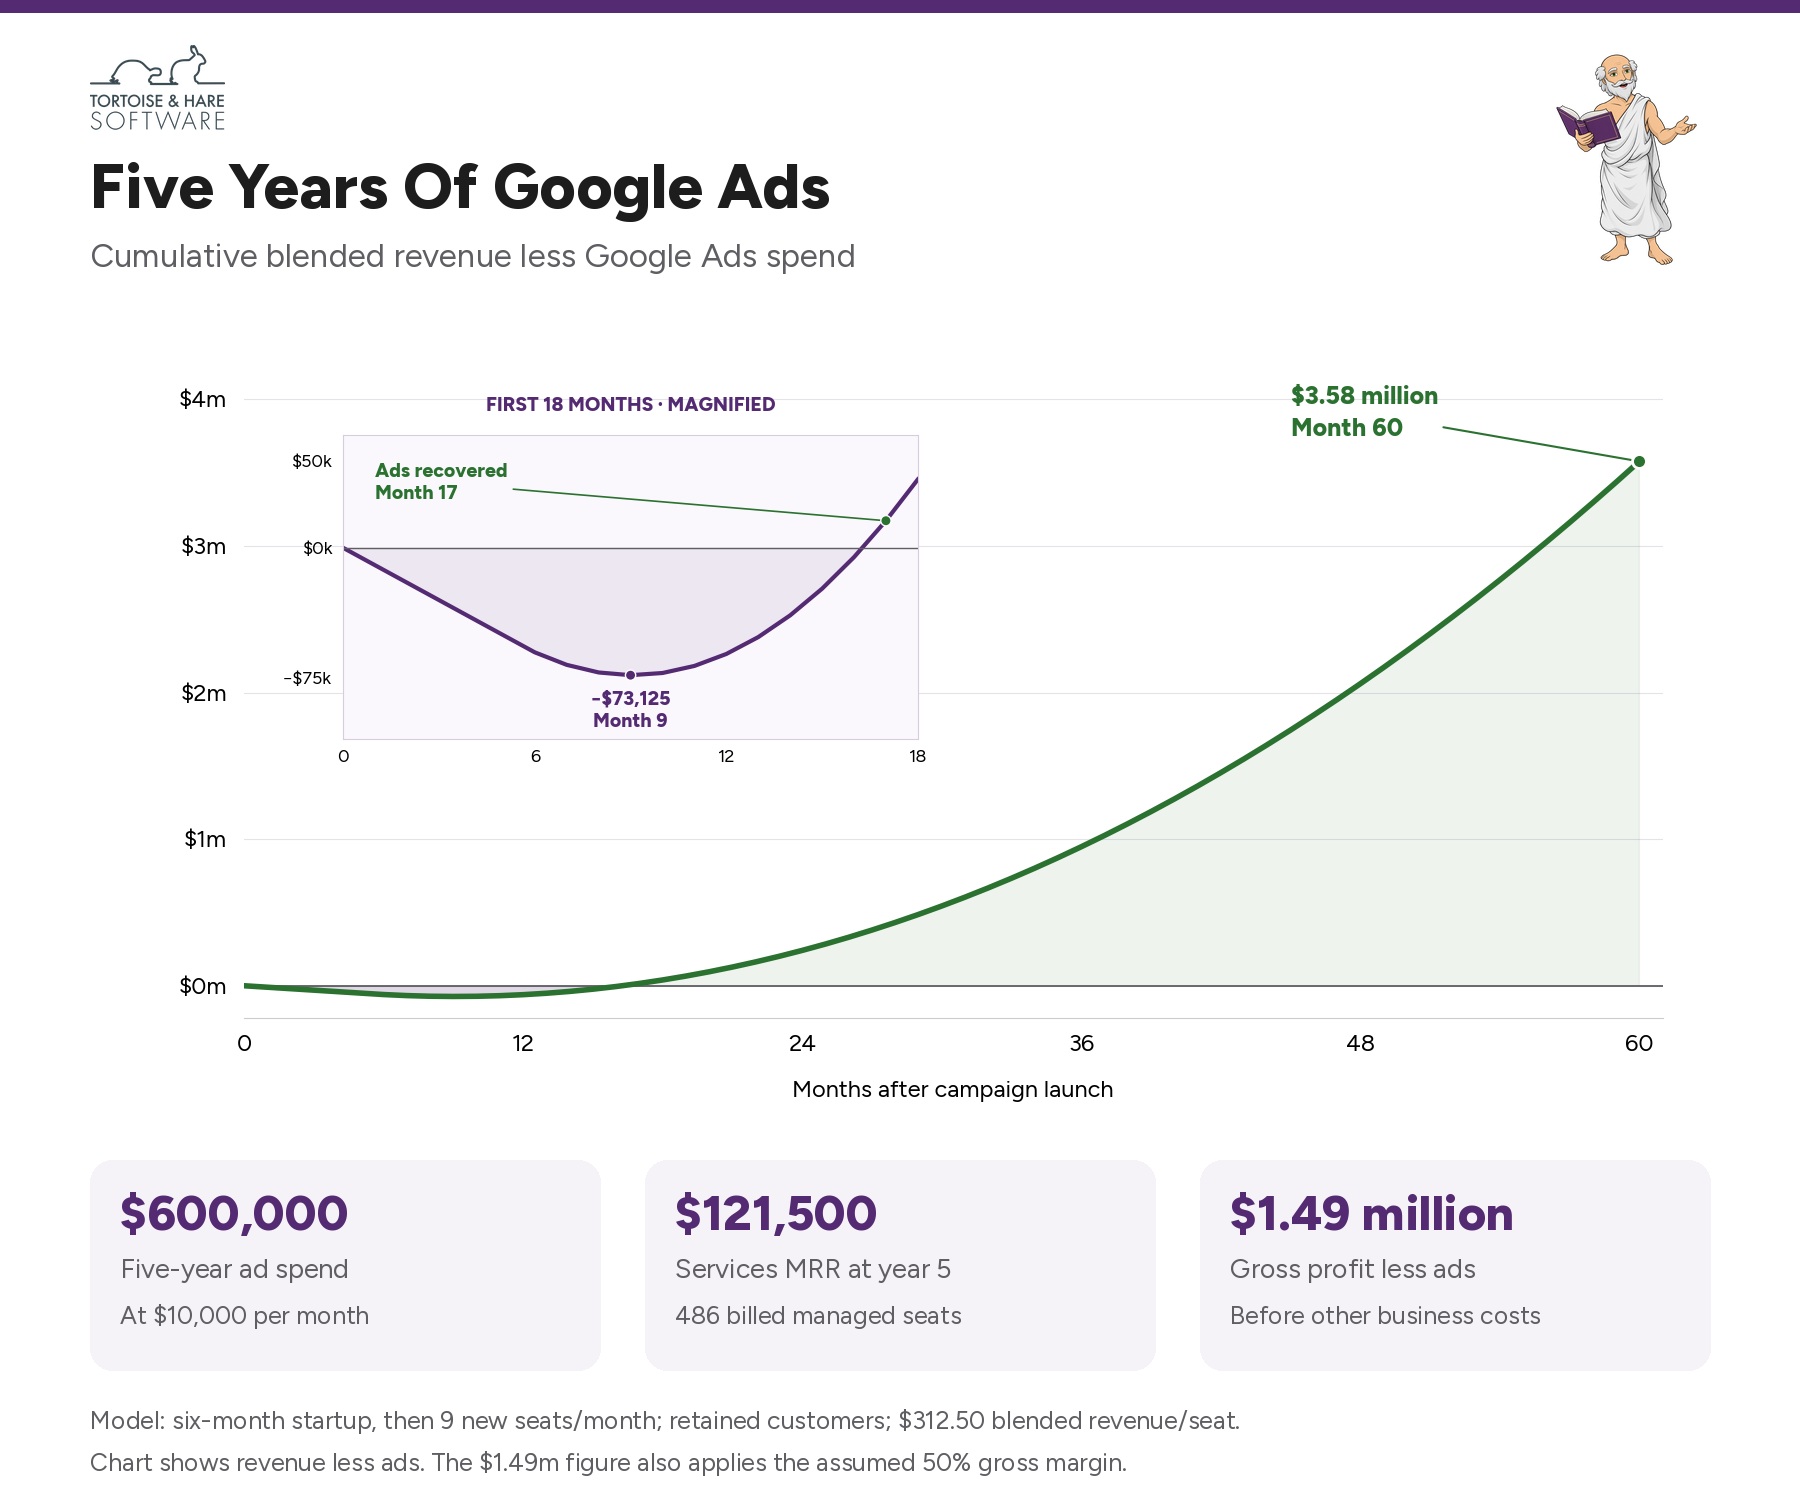
Now keep the same plan going for five years: $10,000 per month in ads, nine new seats per month after startup, and continued revenue from the customers already won. The ad budget stays level while the customer base grows.
| Five-Year Projection | Modeled Result |
|---|---|
| Total Google Ads spend | $600,000 |
| Seats billing in month 60 | 486 |
| Managed services MRR in month 60 | $121,500 |
| Blended monthly revenue in month 60 | $151,875 |
| Total blended revenue collected through month 60 | $4,176,562.50 |
| Collected revenue less Google Ads spend | $3,576,562.50 |
| Gross profit at 50% less Google Ads spend, before other costs | $1,488,281.25 |
By year five, this plan has built $121,500 in managed services MRR. Across the five-year window, it has generated about $4.18 million in blended revenue from $600,000 in ad spend. After applying our 50% gross margin and subtracting ads, about $1.49 million remains. It’s entirely possible to cover your other selling and administrative costs and still achieve a 20% profit margin in this model, provided all remaining expenses stay within about $653,000 over the five-year period.
This is the long-term value of investing in Google Ads for an MSP. The first months fund the effort to attract and win customers. The customers you win then create a growing base of revenue while the campaign keeps bringing in new business. Retaining those customers is what allows each year’s investment to keep contributing to the next.
Conservative Estimates And Room To Outperform
The acquisition and sales assumptions leave room for a stronger result. We’ve worked with MSP clients that beat these lead costs and close rates. A lower CPL, better qualification, a higher close rate, stronger margins, or a shorter sales cycle can improve returns and payback.
For one example, see our case study on an MSP adding $60,000 MRR in one year. We started with Google Ads and expanded the advertising program across LinkedIn and Meta as results supported a larger investment.
For example, lowering CPL to $1,500 and raising the close rate to 30%, with qualification still at 50%, doubles the modeled growth from nine to eighteen seats per month on the same $10,000 budget. That illustrates the upside of improving the funnel. Your results will depend on your market and sales performance.
Keep the favorable simplifications in view too. Full retention and prompt payment are not guaranteed. Replace the estimates with your own sales and financial data as it becomes available. Start with a budget you can manage, whether that’s $5,000 or $10,000 per month, and earn the case for more spending through results.
As an MSP pursuing growth, you need to invest in a way to reach new customers, whether that’s Google Ads, SEO, referrals, events, or another marketing channel. Each takes money, time, or both. The goal of this article is to shine some light on the economics of running Google Ads campaigns so you can compare that investment with your other options and choose a budget that makes sense for your business.
Set An MSP Google Ads Budget You Can Defend
Start with customer value, set your CAC target, then work backward to an affordable lead cost. Use gross profit, qualification rates, and close rates to calculate those limits. Then choose a monthly budget that fits your growth goals and cash position.
You don’t need to promise yourself perfect results to make a sound investment. You need customer economics that work, enough funding to get through the sales cycle, and a way to see which ads become valuable accounts. The five-year view gives you a reason to invest. The monthly numbers give you a way to manage it.
Tortoise and Hare Software connects MSP Google Ads management, landing pages, conversion tracking, and sales results. We help you focus on the opportunities that fit your MSP and use real customer outcomes to guide campaign decisions.
Want to see what a sustainable Google Ads investment could look like for your MSP? Book a free consultation. We’ll help you work through your customer value, acquisition targets, and starting budget.
About The Author